JavaScript Profiler: Real-time Analysis of JavaScript Code Execution
JavaScript Profiler, developed by Germain UX, is a free Chrome add-on that provides real-time analysis of JavaScript code execution. With this tool, users can analyze JavaScript calls and correlate them with application back-end code, database SQL, integration, and more. This allows developers to identify and troubleshoot issues related to JavaScript performance and its impact on the overall user experience.
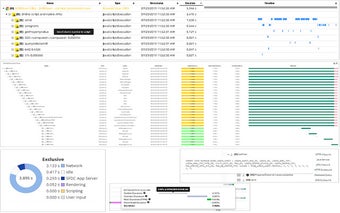
One of the key features of JavaScript Profiler is the ability to view all the analyzed metrics on the Germain UX dashboard. This dashboard can be accessed either on-premise or through the cloud instance provided by Germain UX. The dashboard provides a comprehensive overview of JavaScript execution, allowing developers to monitor and track performance metrics.
In addition to analysis, JavaScript Profiler also offers automation capabilities. Users can automate tasks such as alerts, data updates, service restarts, and reporting. This helps streamline the debugging and optimization process, saving developers time and effort.
Whether you want to analyze JavaScript performance for all your users or target specific users, JavaScript Profiler provides the necessary tools and insights. It allows developers to identify the root causes of performance issues, whether they lie in JavaScript, the browser, network, infrastructure, application, database, or even in the back-end code.
Overall, JavaScript Profiler is a valuable tool for developers looking to optimize JavaScript code execution and improve the overall user experience of their web applications.